
Exporting Correlation Plots

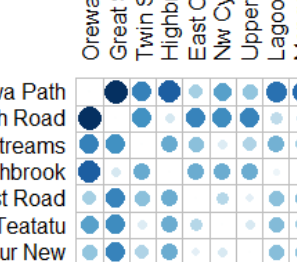
On Windows OS, it is a known fact that exporting high quality graphics in RStudio is not an easy thing. If you try to use "Save as Image" in RStudio, you will see that result is far from useable. Here is an example.
If you are using ggplot2 (which everyone should), exporting high quality PNGs is straight forward. All you have to do is to use type cairo, i.e.
ggsave(plot = plot_name, filename = "Plots/plot.png", type = "cairo", dpi = 600)And, this is how it looks when exported.

Pretty good, isn't it? Now, if only corrplot generated ggplot2 compatible graphics objects. But, it doesn't. So, I went for a Google hunt. After much surfing, wow searching which it took ages, I discovered you can include type=cairo when initialising your graphics device (check this post on Stack Overflow). So, all I have to do was
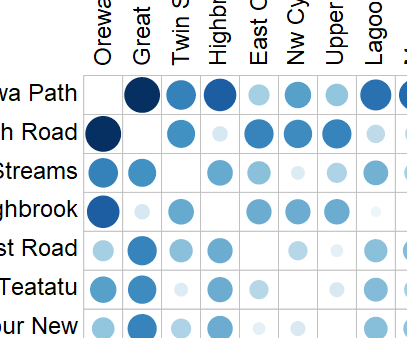
png(height=1800, width=1800, file="Plots/distances.png", type = "cairo")
corrplot(dist_m,
         method = "circle",
         is.corr = F,
         order = "FPC",
         tl.col="black")
dev.off()
This will create a graphics device of size 1800px by 1800px with type=cairo, plot on to the device and shut down the device. Here is how it looks.
Much better, don't you think?